Hot and Cold Lottery Numbers: Why Due Never Means Likely
The short version
Frequency charts are accurate data about draws that have already happened, and they carry no information whatsoever about the next one. Balls and certified random number generators have no memory, so each draw is independent and nothing accumulates while a number is absent. The uneven counts that make a chart look meaningful are precisely what random data produces at these sample sizes.
- Hot: drawn more often in a chosen window. Describes the past only.
- Overdue: a long gap. Nothing is owed and nothing has built up.
- The test: the next draw does not know what the previous one did.
What a hot or a cold number actually is
Take the results of a draw game, choose a window — the last fifty draws, the last year, all time — and count how many times each number appeared. Sort the counts. The top of the list gets called hot, the bottom gets called cold, and the number with the longest run of absences gets called overdue. That is the entire method, and there is nothing wrong with it as bookkeeping. Every table of hot and cold lottery numbers you will find online is built exactly this way.
The problem starts with the next step, where a descriptive count is treated as a forecast. Two incompatible strategies are then sold from the same chart: play the hot numbers because they are running well, or play the cold ones because they must be about to catch up. Both cannot be right, and the reason they can both be sold with equal confidence is that neither has any predictive content at all.
Notice also how much the window choice does. Change the lookback from fifty draws to five hundred and the hot list reshuffles substantially, because at small sample sizes the ordering is dominated by noise. A pattern that changes when you change an arbitrary setting was never a property of the lottery. It was a property of your query.
Hot and cold lottery numbers cannot influence the next draw
The mechanism is worth stating precisely, because it is not a matter of opinion or of odds being long. Draw equipment has no state that carries between draws. A mechanical machine is loaded with a fresh set of balls that are weighed and measured, mixed, and released; nothing inside it records what happened last week. A certified random number generator is tested against published criteria for unpredictability and independence before it is allowed anywhere near a live game.
That is what statisticians mean by independence: the probability of any number appearing in the next draw is unchanged by everything that came before. Hot and cold lottery numbers therefore describe history in the same way a list of last month's weather describes last month. It is real information about a period that has closed.
There is one honest caveat, and it runs the other way. If a machine were genuinely biased, past frequencies would carry information — which is why operators test equipment, rotate ball sets, and submit generators for certification. Detecting a small bias reliably needs vastly more draws than a single game produces in a decade, and it is a question answered with a formal test rather than by looking at a chart.
The gambler's fallacy in plain language
The intuition behind "due" is that randomness has to balance out, so a shortfall now implies a surplus later. That belief is called the gambler's fallacy, and it survives because it is a slightly wrong version of something true.
The true statement is the law of large numbers: as the number of draws grows, the proportion of times each number appears converges towards its expected share. The fallacy is imagining that this happens through compensation — that the universe pushes lagging numbers forward. It happens through dilution. An early deficit is not repaid; it simply becomes a smaller and smaller fraction of an ever larger total. A number twelve appearances behind after two hundred draws will still be roughly twelve behind after two thousand, and by then twelve is a rounding error.
Randomness has no memory and no debts. Nothing is owed to a number that has been absent, because there is nothing in the system capable of keeping score.
The most repeated illustration comes from a roulette table at the Monte Carlo Casino in 1913, where the ball is reported to have landed on black twenty-six times in succession. Players lost enormous sums backing red on the reasoning that it was overdue. The wheel was not aware of the streak, and each spin remained an independent event with unchanged probabilities.
What the chart shows versus what it is taken to mean
| What you see | What it accurately says | What it does not say |
|---|---|---|
| Number appeared 31 times, another 13 | The counts over the window you chose | Anything about which will appear next |
| Number absent for 60 draws | A gap of that length has occurred | That a gap is closing or owed |
| Three numbers keep appearing together | That combination occurred in the past | That the pairing has any tendency to repeat |
| A visible cluster in one decade of numbers | Clustering happened in this sample | That the machine favours that range |
| The hot list changes when you widen the window | Small samples are noisy | That one window is the correct one |
The tool this article relates to
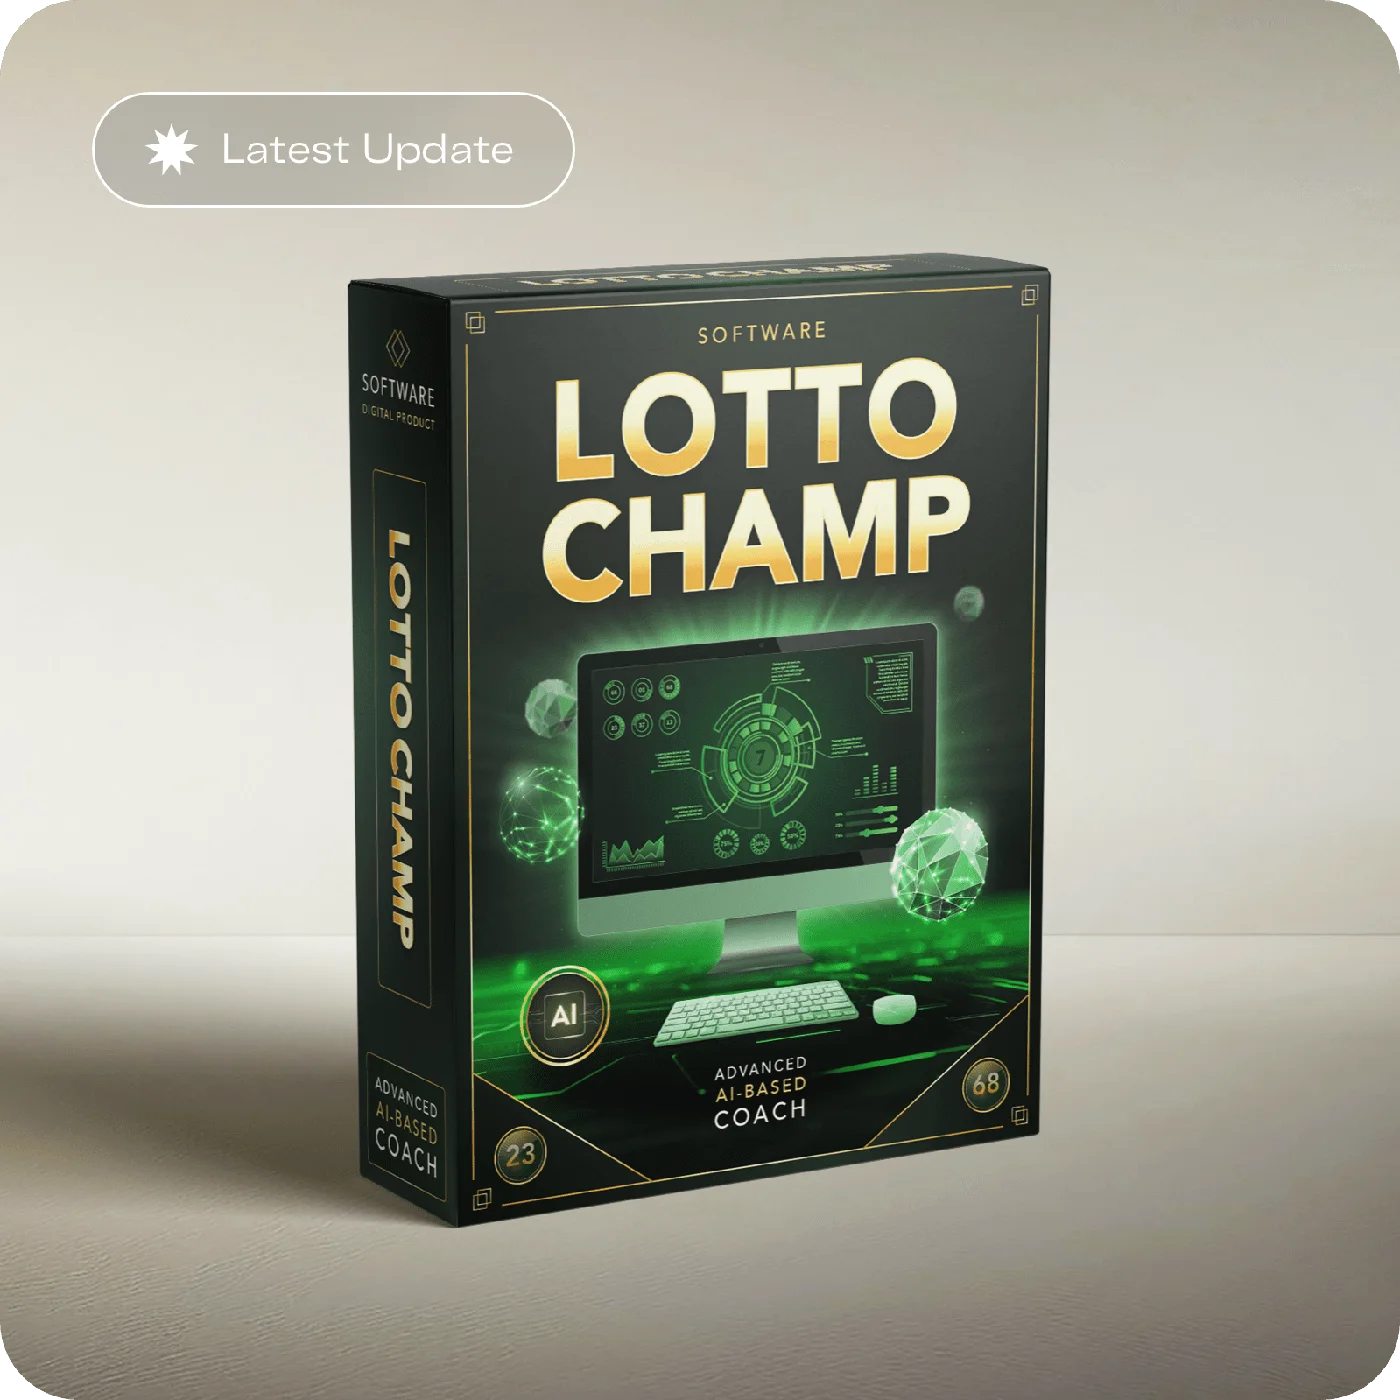
If you have been looking for where to buy LottoChamp, the members area is sold through one official checkout, with the full LottoChamp price and terms shown before you commit and 60 days to change your mind.
Get OfferThe arithmetic of ordinary lumpiness
Here is the part that usually settles the argument, and you can redo it on paper. Take a game that draws five numbers from a field of sixty-nine, which is the main field used by Powerball, and look at three hundred draws.
Three hundred draws produce fifteen hundred individual ball slots, shared across sixty-nine numbers, so the average number appears about twenty-two times. The spread around that average is given by the standard deviation of a binomial count: the square root of the number of draws times the chance per draw times one minus that chance. With three hundred draws and a chance of five in sixty-nine, that works out at roughly four and a half.
So about two thirds of the numbers should land between seventeen and twenty-six appearances, and almost all of them between thirteen and thirty-one. Because you are looking at sixty-nine numbers at once, the highest count will typically sit around ten above the average and the lowest around ten below it. A chart where the hottest number has appeared roughly twice as often as the coldest is not evidence of anything. It is the expected appearance of a fair game over that many draws.
This is the single most useful idea in the whole subject: our intuition about what random data should look like is badly calibrated. We expect randomness to look even, so genuinely even data looks suspicious and genuinely random data looks patterned. Statisticians formalise the check with a goodness-of-fit test, which asks whether the observed spread is larger than chance comfortably explains. For public draw games with published histories, it almost never is.
The one thing number choice does change
Selection method cannot alter your probability of matching the draw. It can alter how many other people hold the same ticket if that combination comes up, because human choices are heavily clustered while the draw is not.
Numbers from one to thirty-one are played far more heavily than the rest of the field, since so many players use birthdays and anniversaries. Straight lines, diagonals and neat patterns on the play slip attract many entries. Sequences such as one to six are chosen by a surprising number of people who assume nobody else would. And because published hot and cold lists are read by everyone who reads them, deliberately playing overdue numbers is itself a popular strategy, which quietly undermines the only real benefit it could have had.
The honest summary: choosing less-played numbers does not make a win more likely, but it can make a shared jackpot less likely if a win happens. That is a difference in the size of an outcome whose probability is unchanged — worth knowing, not worth paying much for, and not what hot and cold charts are usually sold as doing.

What frequency analysis cannot do
Plainly stated, so there is no ambiguity. It cannot tell you which numbers will be drawn next. It cannot improve the published odds of any game, because those odds are a property of the number field and the format, not of your selection method. It cannot identify a combination that is more likely than another valid combination, since in a fair draw they are all equal.
Put bluntly, hot and cold lottery numbers are worth what a log of last month's weather is worth when you are deciding whether to take an umbrella tomorrow: accurate, mildly interesting, and not an input to the decision.
It also cannot prove the draw is fair. Absence of a visible pattern in a few hundred results is weak evidence either way, which is why fairness rests on physical testing, sealed procedures, independent observation and generator certification rather than on hobbyist chart-reading.
And it cannot be rescued by more computing power. Feeding the same history into a larger model changes nothing about the information content of the data, a point covered at length in what machine learning cannot do with a random draw. Where the evidence for a method is weak, the honest position is to say so rather than to dress the weakness in more mathematics.
Where a number tool honestly fits
None of this makes a generator useless; it makes its actual job clear. A tool that produces valid combinations quickly, keeps a record of what you played, and stops you rewriting the same birthday set every week is doing something real. What it cannot do is make any of those combinations more likely to appear.
LottoChamp is a members-area app that generates and stores selections, and it is fairest to judge it as exactly that. If you are comparing lottery number generator apps, compare the workflow, the storage, the terms and the refund window, and treat any language about improved chances as marketing rather than mechanism. The next question most people ask is what a ticket is actually worth in the first place, which is the subject of the expected value of a lottery ticket.
Judge it on the workflow, not the odds
One payment, lifetime access to the members area, and a 60-day refund window if the workflow is not what you wanted.
Get OfferFrequently asked questions
Are hot and cold lottery numbers real?
The counts are real: some numbers genuinely have appeared more often than others over any stretch of past draws. What is not real is the implication. Each draw is independent, so a number's history has no effect on whether it appears next time, and the uneven counts are exactly what random data produces.
Is a number that has not appeared for months due?
No. Balls and certified random number generators have no memory of previous draws, so nothing accumulates during a gap. A number absent for a year has exactly the same chance in the next draw as one drawn last week, and treating it as owed is the gambler's fallacy.
Does picking hot numbers improve my odds of winning?
No. Every valid combination in a fair draw carries the same probability, so no filter based on past frequency raises or lowers your chance of matching. Selection method can only affect how many other players hold the same combination, not whether that combination is drawn.
Could a frequency chart ever reveal a faulty machine?
In principle yes, and that is a legitimate statistical question answered with a goodness-of-fit test rather than by eye. In practice it takes far more draws than any single game provides to detect a small bias, and operators run their own equipment testing and certification programmes for exactly this purpose.